
Tipping frequency is defined as the rate at which an audience voluntarily sends financial tips to a creator over a given period. Understanding how tipping frequency signals content success is one of the most underused skills in a creator’s analytics toolkit. Unlike raw view counts or follower growth, tipping frequency reflects genuine audience trust. It is shaped by payment friction, social norms around tipping culture, and the psychological state of your audience. Crucially, tipping frequency and tip value are two separate metrics, and confusing them leads to bad decisions about content strategy and monetization.
How tipping frequency signals content success through payment behavior
Payment method is the single biggest external factor distorting tipping frequency data. Contactless payments produce a tipping rate of only 4.6% compared to 14.9% for chip and PIN transactions. That gap does not mean contactless audiences value content less. It means the payment experience changes tipping from a habitual reflex into a deliberate choice.
For creators, this distinction matters enormously. A drop in tipping frequency after switching to a frictionless payment interface like Apple Pay or Google Pay is not a red flag. It is a shift in tipping behavior, not audience sentiment. Frictionless payment interfaces change who tips and when, but the tips that do come through tend to carry stronger intent behind them.

| Payment Method | Tipping Rate | What It Signals |
|---|---|---|
| Chip and PIN | 14.9% | Higher habitual tipping frequency |
| Contactless / digital | 4.6% | Lower but more deliberate tipping |
| No-account instant pay | Higher conversion | Reduced friction increases tip completion |
Creators should always note the payment context before drawing conclusions from a frequency change. A sudden drop in tips after migrating to a new platform may simply reflect a change in payment flow, not a change in audience loyalty.
- Track tipping frequency separately for each payment channel you use
- Compare tip frequency before and after any interface change
- Weight deliberate digital tips more heavily than habitual low-friction tips
- Avoid reading a frequency dip as a content quality failure
Pro Tip: If you recently added Apple Pay or Google Pay as a tipping option, give your audience at least 30 days before drawing conclusions from the frequency data. Behavioral adjustment takes time.
What is tip fatigue and how does it distort tipping signals?
Tip fatigue is the psychological exhaustion that sets in when audiences feel pressured to tip too often or at inappropriate moments. 44% of consumers report leaving smaller tips than before, and 59% say they feel obligated to tip rather than genuinely motivated. That combination is a warning sign for any creator who relies on tipping frequency as a success indicator.
The psychological mechanism behind tip fatigue is called reactance. When tipping feels demanded rather than earned, audiences push back by tipping less or not at all. Over-requesting tips reduces consumer willingness to tip and damages long-term audience relationships. The damage is not always visible immediately. Tip frequency may hold steady for weeks before declining sharply.
“Tipping should feel like applause, not a toll booth. The moment your audience feels charged rather than appreciated, frequency drops and trust erodes.”
Creators can protect tipping frequency by following a few clear principles:
- Request tips only after delivering clear, specific value (a tutorial, a solved problem, an exclusive insight)
- Avoid placing tip prompts at the start of content or during low-value moments
- Space tipping requests so they do not appear in every piece of content
- Use instant gratification cues to frame tips as a natural thank-you rather than a fee
Pro Tip: Rotate your tipping call-to-action language. Repeating the same phrase in every video trains audiences to tune it out. Fresh, specific language tied to the value you just delivered converts far better.
Tipping frequency vs. tip value: what each metric actually tells you
High tipping frequency and high tip value are not the same thing, and treating them as interchangeable is a common mistake. High-volume, low-value tipping often correlates with viral content, where broad reach drives many small tips from casual viewers. Niche creators, by contrast, typically see lower tip frequency but higher average tip values per transaction.
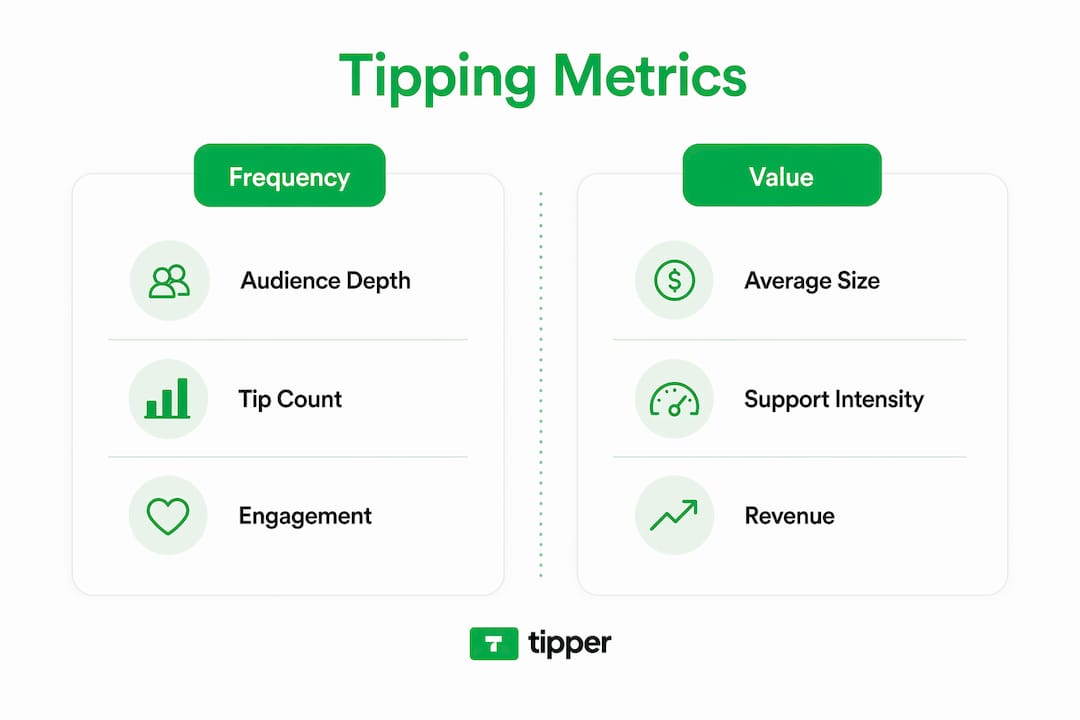
Tipping frequency signals audience depth rather than just reach. A creator with 500 tips at $2 each has a very different audience profile than one with 50 tips at $20 each. The first has broad but shallow support. The second has a loyal, high-value community. Both are worth having, but they require different content and monetization strategies.
| Tipping Pattern | What It Signals | Best Response |
|---|---|---|
| High frequency, low value | Broad reach, viral appeal | Focus on volume content and brand deals |
| Low frequency, high value | Loyal niche community | Deepen exclusive content and direct support |
| Declining frequency, stable value | Audience shrinking but committed | Prioritize retention over acquisition |
| Rising frequency, rising value | Strong growth and trust | Scale content output and tipping touchpoints |
Creators should segment tipping data by both dimensions before making any content decisions. Relying on frequency alone produces a distorted picture of content performance.
- Pull both tip count and average tip value from your analytics monthly
- Map each metric to specific content types to identify what drives each pattern
- Use cross-platform tipping data to compare audience behavior across channels
- Treat high average tip value as a stronger sustainability signal than raw frequency
What complementary metrics should creators track alongside tipping frequency?
Tipping frequency is a lagging indicator. It reflects trust that was built over time, not the immediate performance of a single piece of content. Content success is better predicted by completion rates of 50–80% and engagement velocity spikes within the first 30–60 minutes of publishing. Those are leading indicators that algorithms respond to directly.
Tipping frequency tells you about the quality of your audience relationship. Completion rate and engagement velocity tell you about the quality of a specific piece of content. You need both to make good decisions.
- Completion rate. A completion rate above 50% signals that your content holds attention. Above 80% is a strong algorithmic signal on most short-form platforms. Track this per video, not as an average.
- Engagement velocity. The speed at which likes, comments, and shares accumulate in the first hour after publishing predicts algorithmic distribution. A slow start rarely recovers.
- Return viewer rate. The percentage of viewers who watch your content more than once indicates genuine interest. High return rates often precede increases in tipping frequency.
- Tip-to-view ratio. Divide total tips by total views for a given content piece. This ratio isolates tipping behavior from reach and gives a cleaner signal of audience depth.
- Tip timing relative to content. Tips that arrive immediately after publishing indicate a highly engaged core audience. Tips that trickle in over weeks suggest discovery-driven reach rather than community loyalty.
Pro Tip: Build a simple monthly spreadsheet that tracks completion rate, engagement velocity, tip count, and average tip value side by side. Patterns across these four columns will tell you more than any single metric alone.
How can creators optimize tipping strategies to improve frequency signals?
The most effective tipping strategies place requests at moments of peak perceived value. Mapping tipping opportunities to high-value content moments preserves audience trust and stabilizes conversion rates over time. A tip prompt placed immediately after solving a viewer’s specific problem converts far better than a generic end-screen request.
Interface design also directly affects tipping frequency. Frictionless, account-free payment options increase tip conversion by removing the steps that cause drop-off. Requiring a viewer to create an account before tipping eliminates a large portion of potential tips. Platforms that support Apple Pay, Google Pay, or one-click tipping links see meaningfully higher completion rates.
- Place tip prompts after delivering a clear, specific insight rather than at the start or end of every piece
- Use a personalized tipping link that works without account creation
- Accept multiple payment methods to reduce friction for different audience segments
- Monitor frequency changes after each interface or placement adjustment to isolate what drives behavior
- Avoid adding tip prompts to every content piece. Scarcity of the ask increases its perceived sincerity
Pro Tip: Test placing your tipping link in the first comment rather than only in the bio. Viewers who engage with comments are already in a higher-trust state and convert at a higher rate.
Key takeaways
Tipping frequency signals content success most accurately when interpreted alongside tip value, payment method context, and leading engagement metrics like completion rate and engagement velocity.
| Point | Details |
|---|---|
| Payment method distorts frequency | A drop in tips after switching to contactless does not mean lower content quality. |
| Tip fatigue is a real risk | 44% of consumers already tip less. Over-requesting accelerates this decline. |
| Frequency and value are separate signals | High frequency reflects broad reach; high average value reflects loyal community depth. |
| Tipping is a lagging indicator | Pair tipping data with completion rate and engagement velocity for accurate content assessment. |
| Placement drives conversion | Tipping requests placed at high-value content moments consistently outperform generic prompts. |
What I have learned from watching tipping data evolve
Tipping frequency is one of the most misread metrics I have seen creators act on. The instinct is to treat a drop in tips as a sign that content is getting worse. That is almost never the right interpretation. Payment method changes, platform migrations, and audience growth all shift frequency without touching content quality at all.
The creators who use tipping data well treat it as a relationship barometer, not a performance score. When frequency rises steadily over months, it means the audience is deepening its trust. When it drops sharply after a specific content change, that is worth investigating. But a slow drift downward often just means the audience is growing and the core supporters are becoming a smaller percentage of a larger total.
The other mistake I see constantly is chasing frequency at the expense of value. A creator who adds tip prompts to every video, every newsletter, and every social post will see short-term frequency gains followed by a hard drop. Audiences have a finite tolerance for being asked. Respect that limit and your tipping data will stay meaningful. Ignore it and the metric becomes noise.
The most sustainable approach is to build content that earns tips without demanding them. When a viewer tips without being prompted, that is the clearest signal of content success you will ever get.
— Tipper
Tipper makes tipping frequency work for you
Tipping frequency only becomes a useful signal when your audience can actually tip without friction. Tipper gives creators a personalized tipping link that works instantly, with no account required from the supporter. Viewers can pay with Apple Pay or Google Pay in seconds, which removes the drop-off that kills conversion on most platforms.
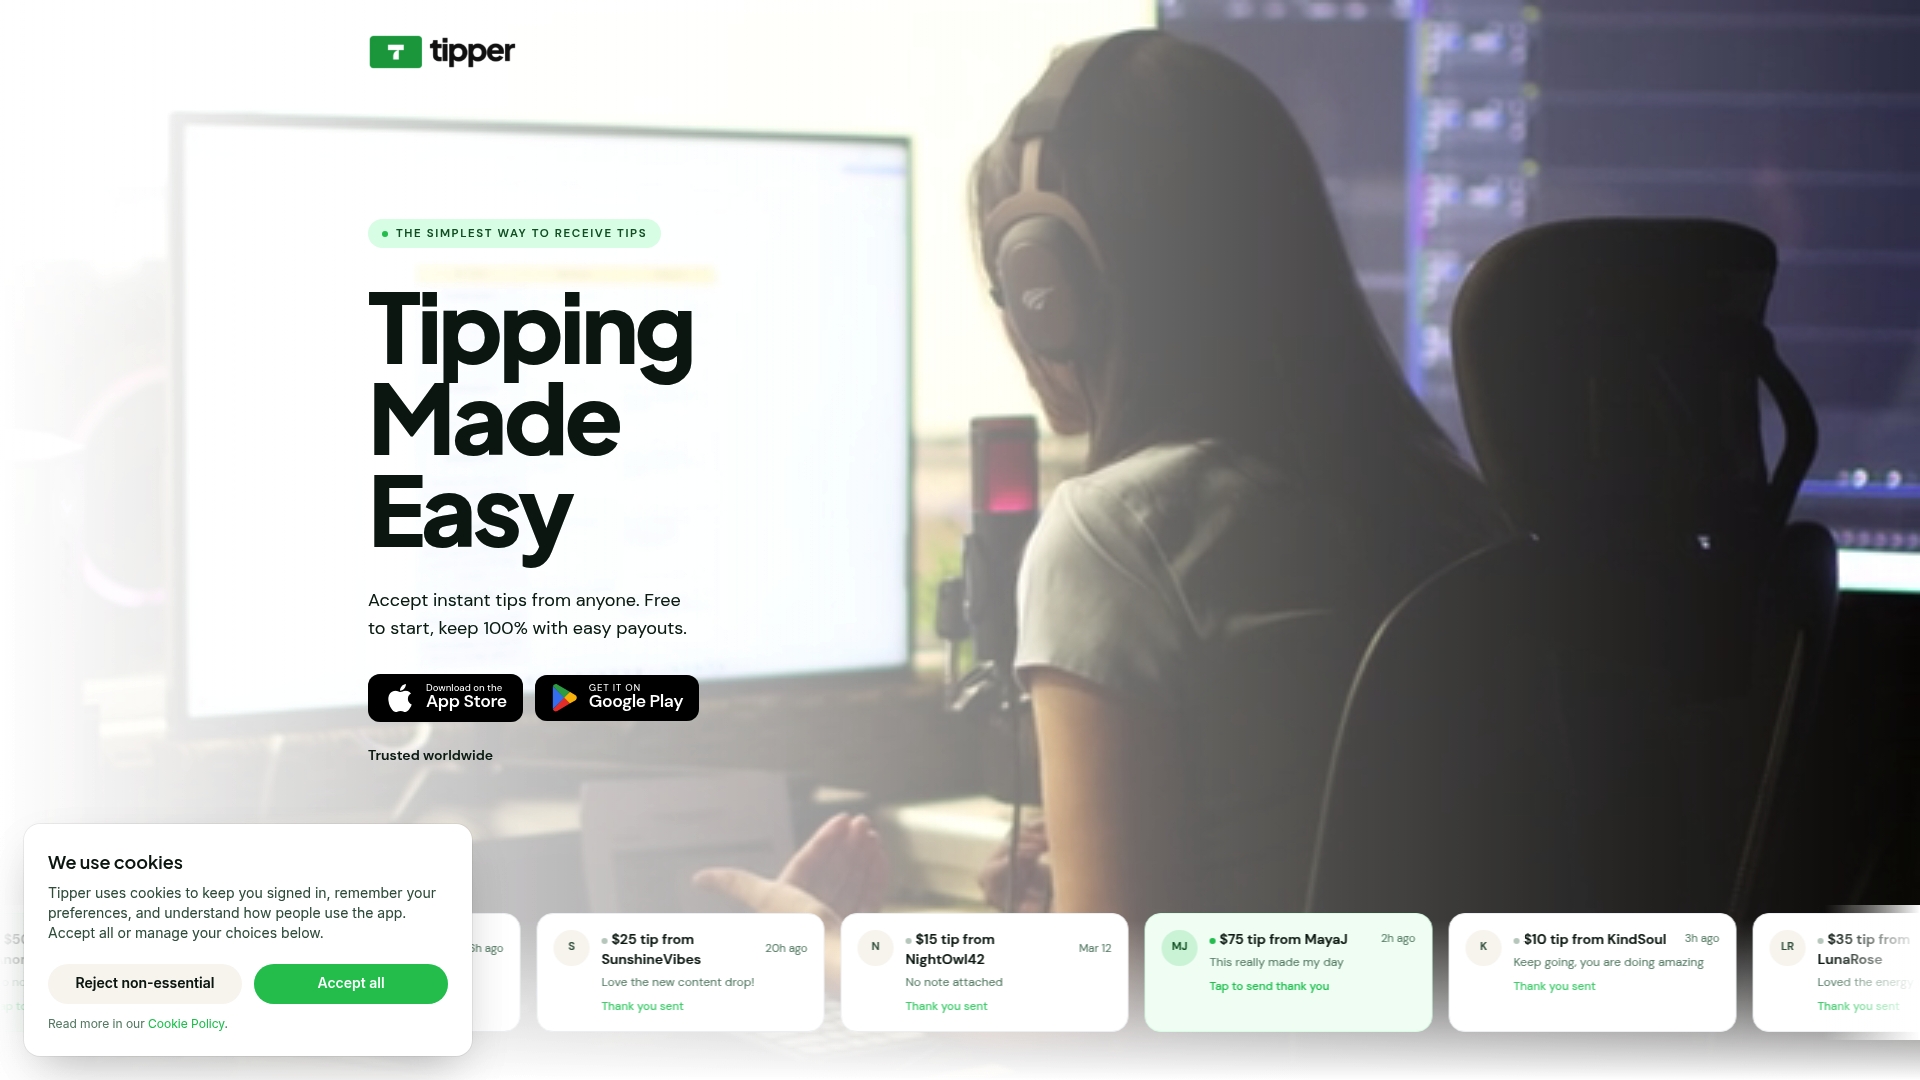
Creators keep 100% of every tip, and supporters can attach a note or video message to make the moment personal. If you want tipping data that actually reflects your audience’s engagement rather than payment barriers, start with Tipper and see how a frictionless setup changes your numbers. For a deeper look at how instant payments work, the instant tip payment guide covers everything you need to set up in 2026.
FAQ
What does tipping frequency actually measure?
Tipping frequency measures how often an audience voluntarily sends financial tips over a set period. It reflects audience trust and engagement depth rather than raw content reach.
Why did my tipping frequency drop after switching payment methods?
Contactless and digital payments produce lower tipping rates than traditional methods. A tipping rate of 4.6% for contactless versus 14.9% for chip and PIN shows this is a payment friction effect, not a content quality signal.
How does tip fatigue affect my tipping data?
Tip fatigue occurs when audiences feel pressured by too many or poorly timed tipping requests. It causes reactance, where viewers tip less or stop tipping entirely, which distorts frequency as a success indicator.
Should I focus on tip frequency or average tip value?
Track both together. High frequency with low values signals broad reach. Low frequency with high average values signals a loyal, high-value community. Neither metric alone gives an accurate picture of content success.
What metrics should I combine with tipping frequency?
Pair tipping frequency with completion rate, engagement velocity in the first 30–60 minutes, and return viewer rate. These leading indicators give context that tipping frequency, as a lagging metric, cannot provide on its own.




Leave A Comment